IntroductionWhat is machine learning?Getting started with Scikit-LearnWhat will we cover today?
Figure 1
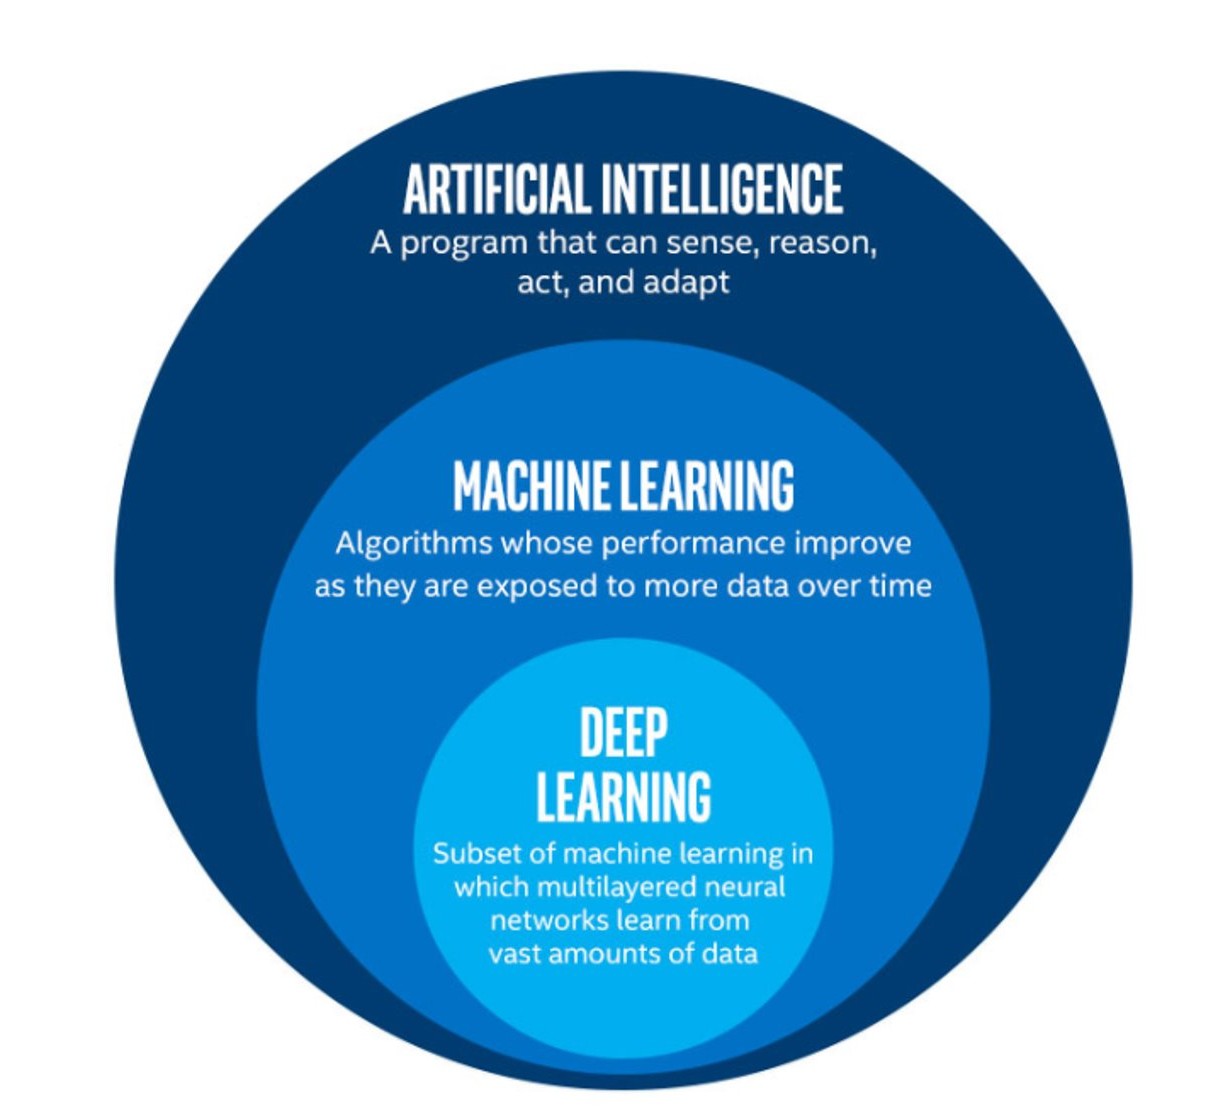 The image above is by Tukijaaliwa, CC BY-SA 4.0, via Wikimedia Commons,
original source
The image above is by Tukijaaliwa, CC BY-SA 4.0, via Wikimedia Commons,
original source
Figure 2
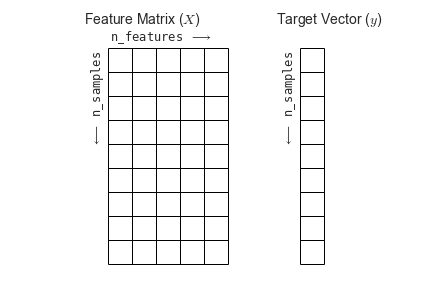 Figure from the Python Data
Science Handbook
Figure from the Python Data
Science Handbook
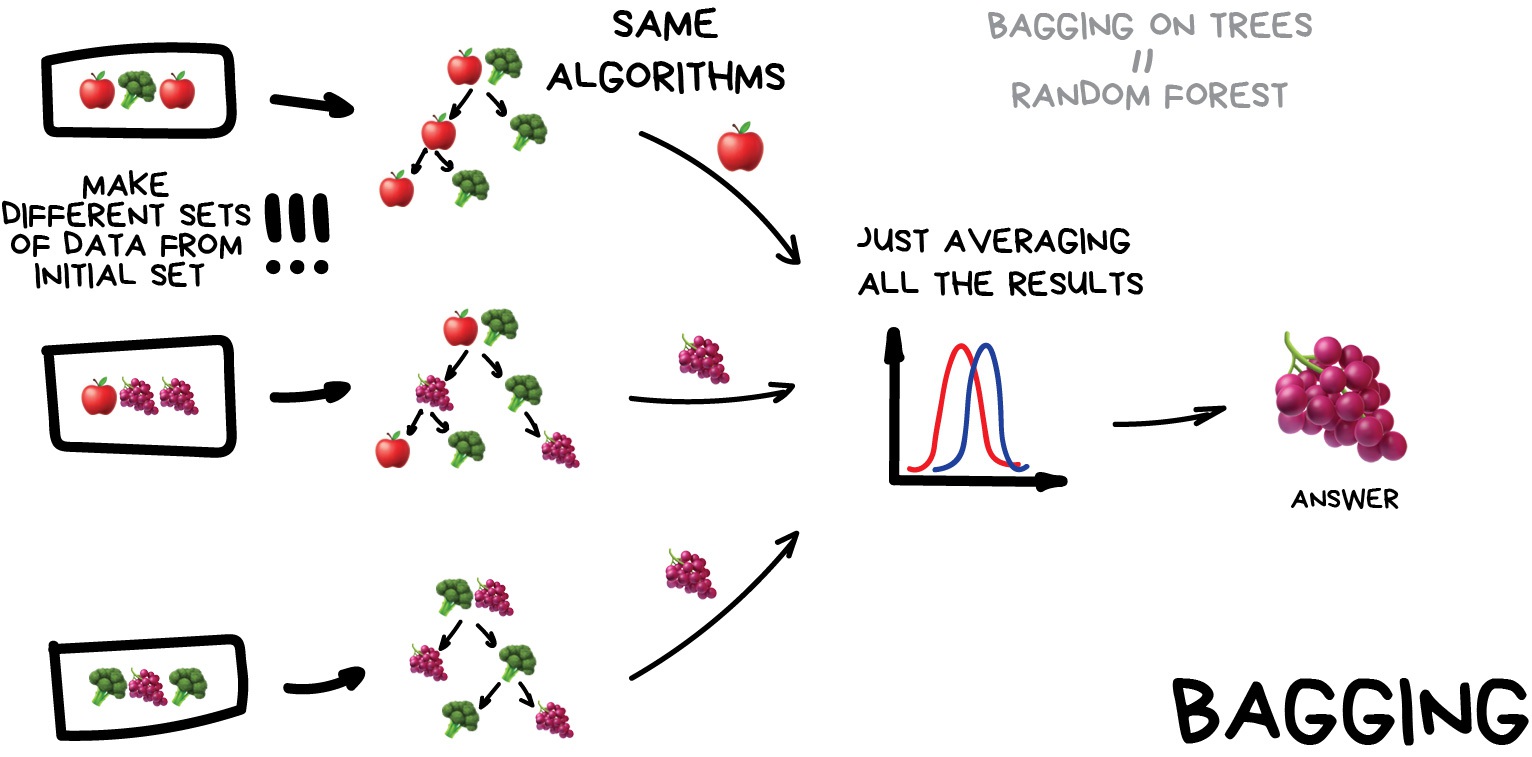
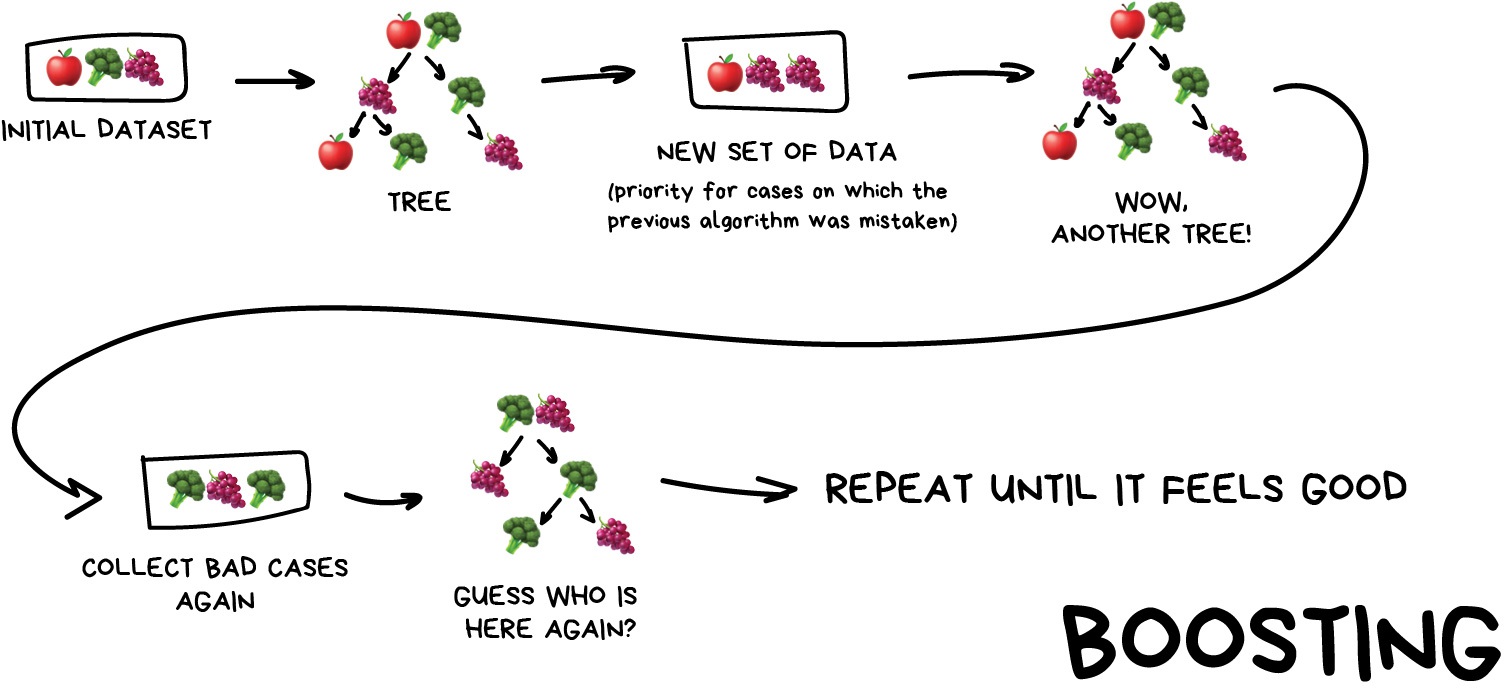
Figure 3
 Image from Vasily
Zubarev via their blog with modifications in blue to denote lesson
content.
Image from Vasily
Zubarev via their blog with modifications in blue to denote lesson
content.
Supervised methods - RegressionSupervised learningRegression
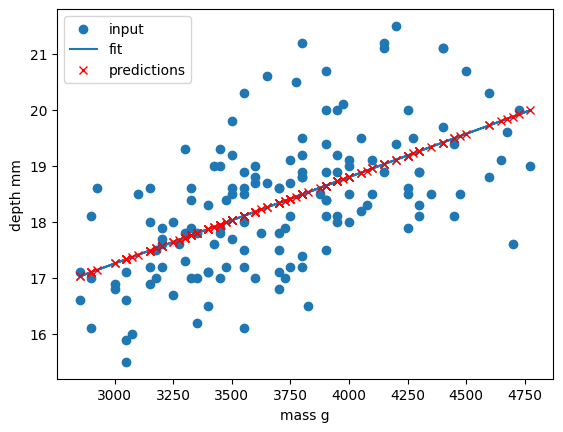
Figure 1
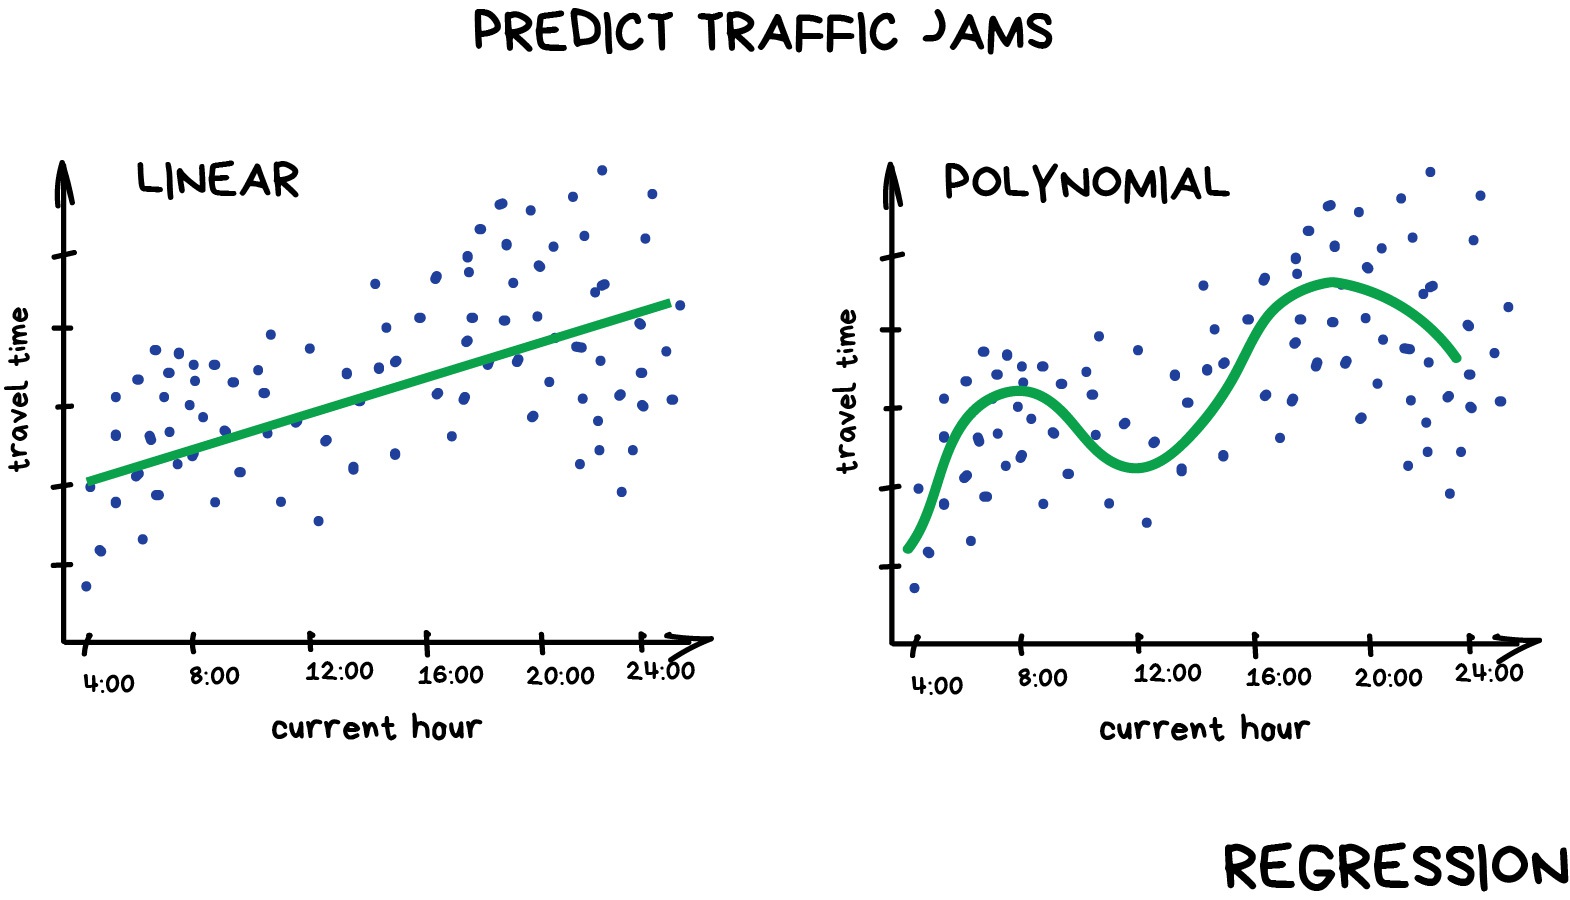
Example of linear and polynomial
regressions
Figure 2
Comparison of the regressions of our
dataset
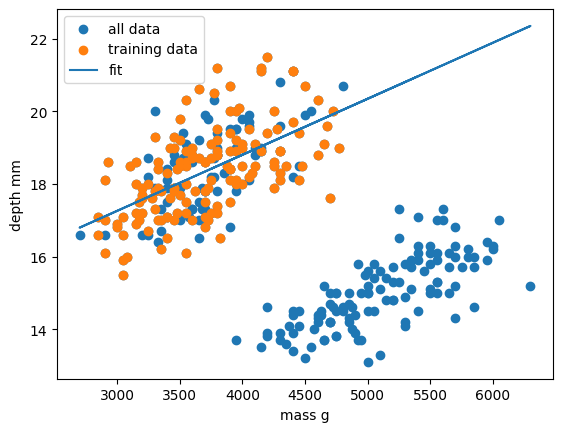
Figure 3
Comparison of the regressions of our
dataset
Figure 4
Comparison of the regressions of our
dataset
Figure 5
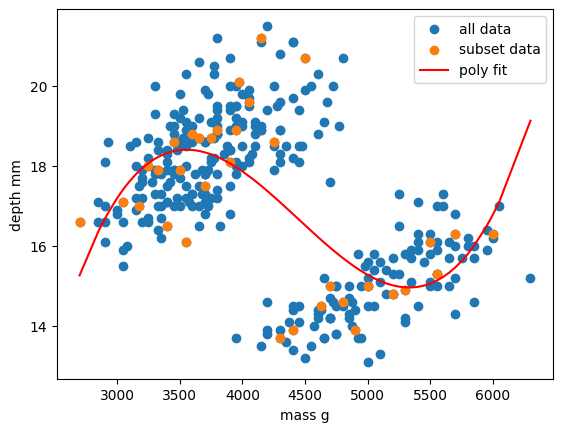
Comparison of the regressions of our
dataset
Supervised methods - ClassificationClassification
Figure 1
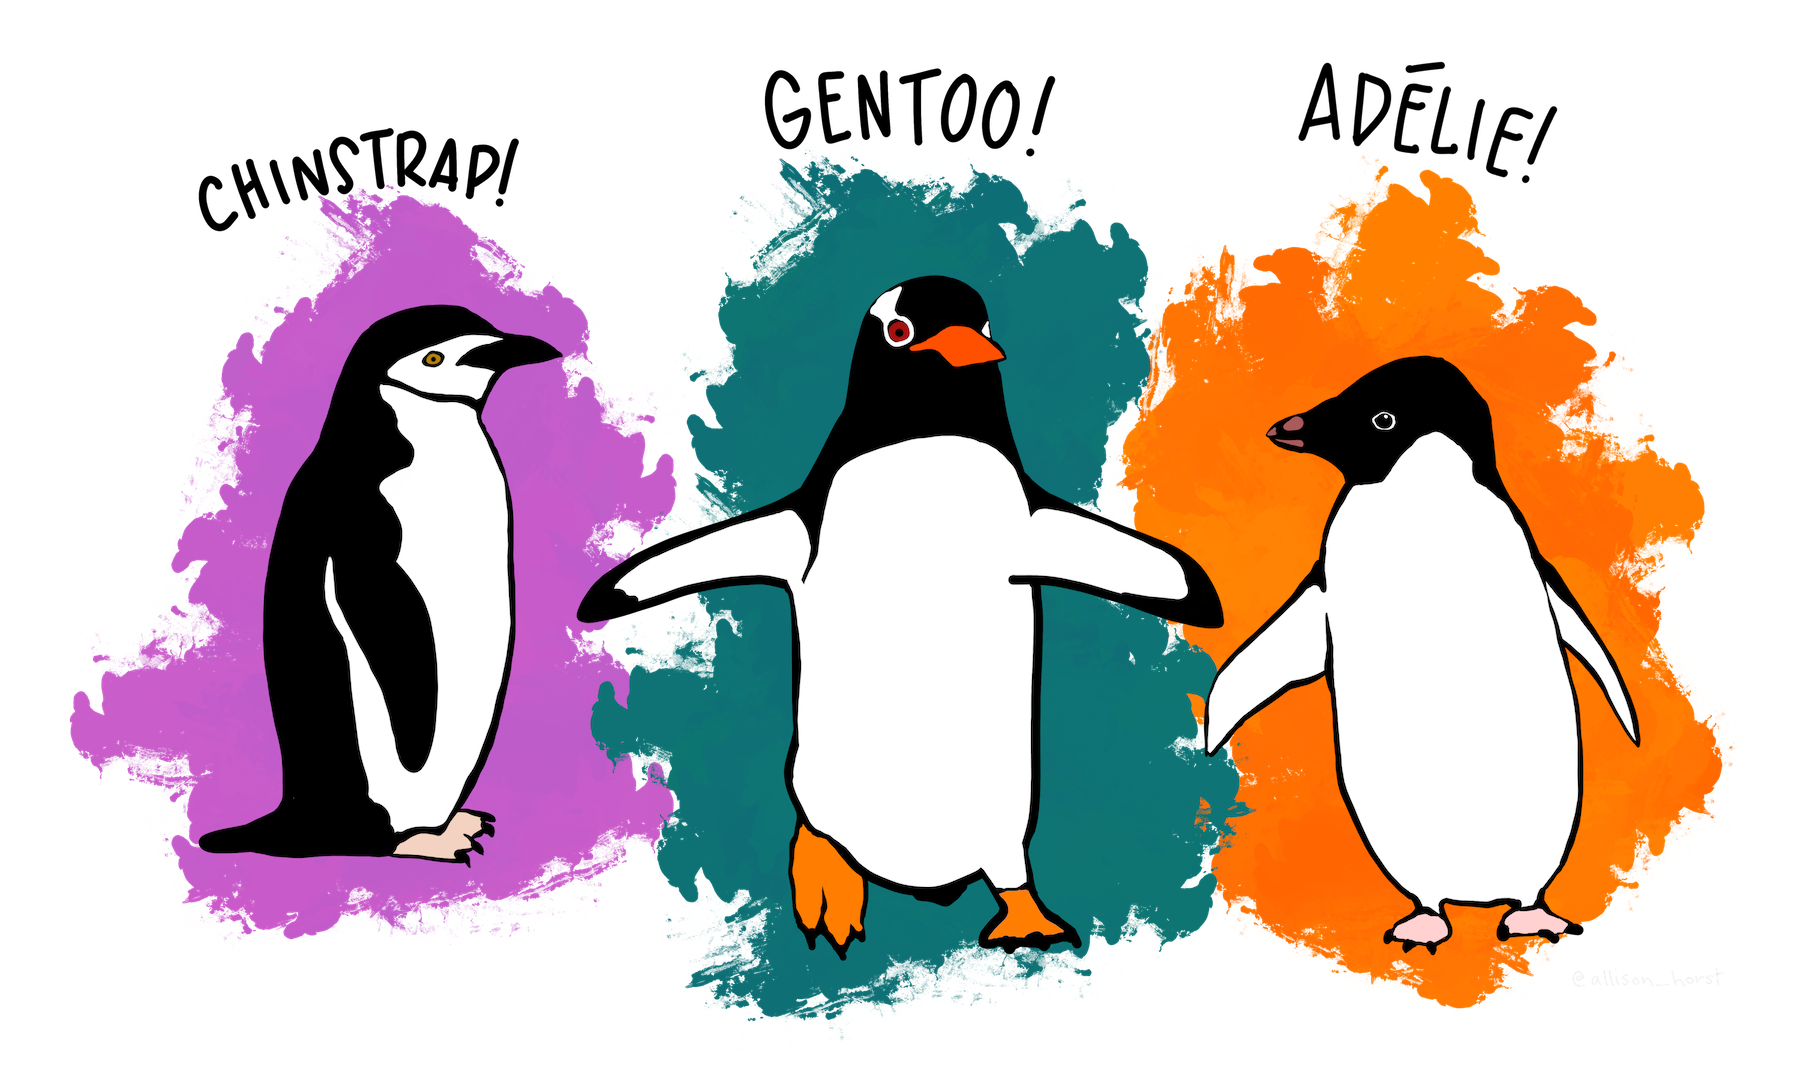
Artwork by @allison_horst
Figure 2
The physical attributes measured are flipper length, beak length,
beak width, body mass, and sex. 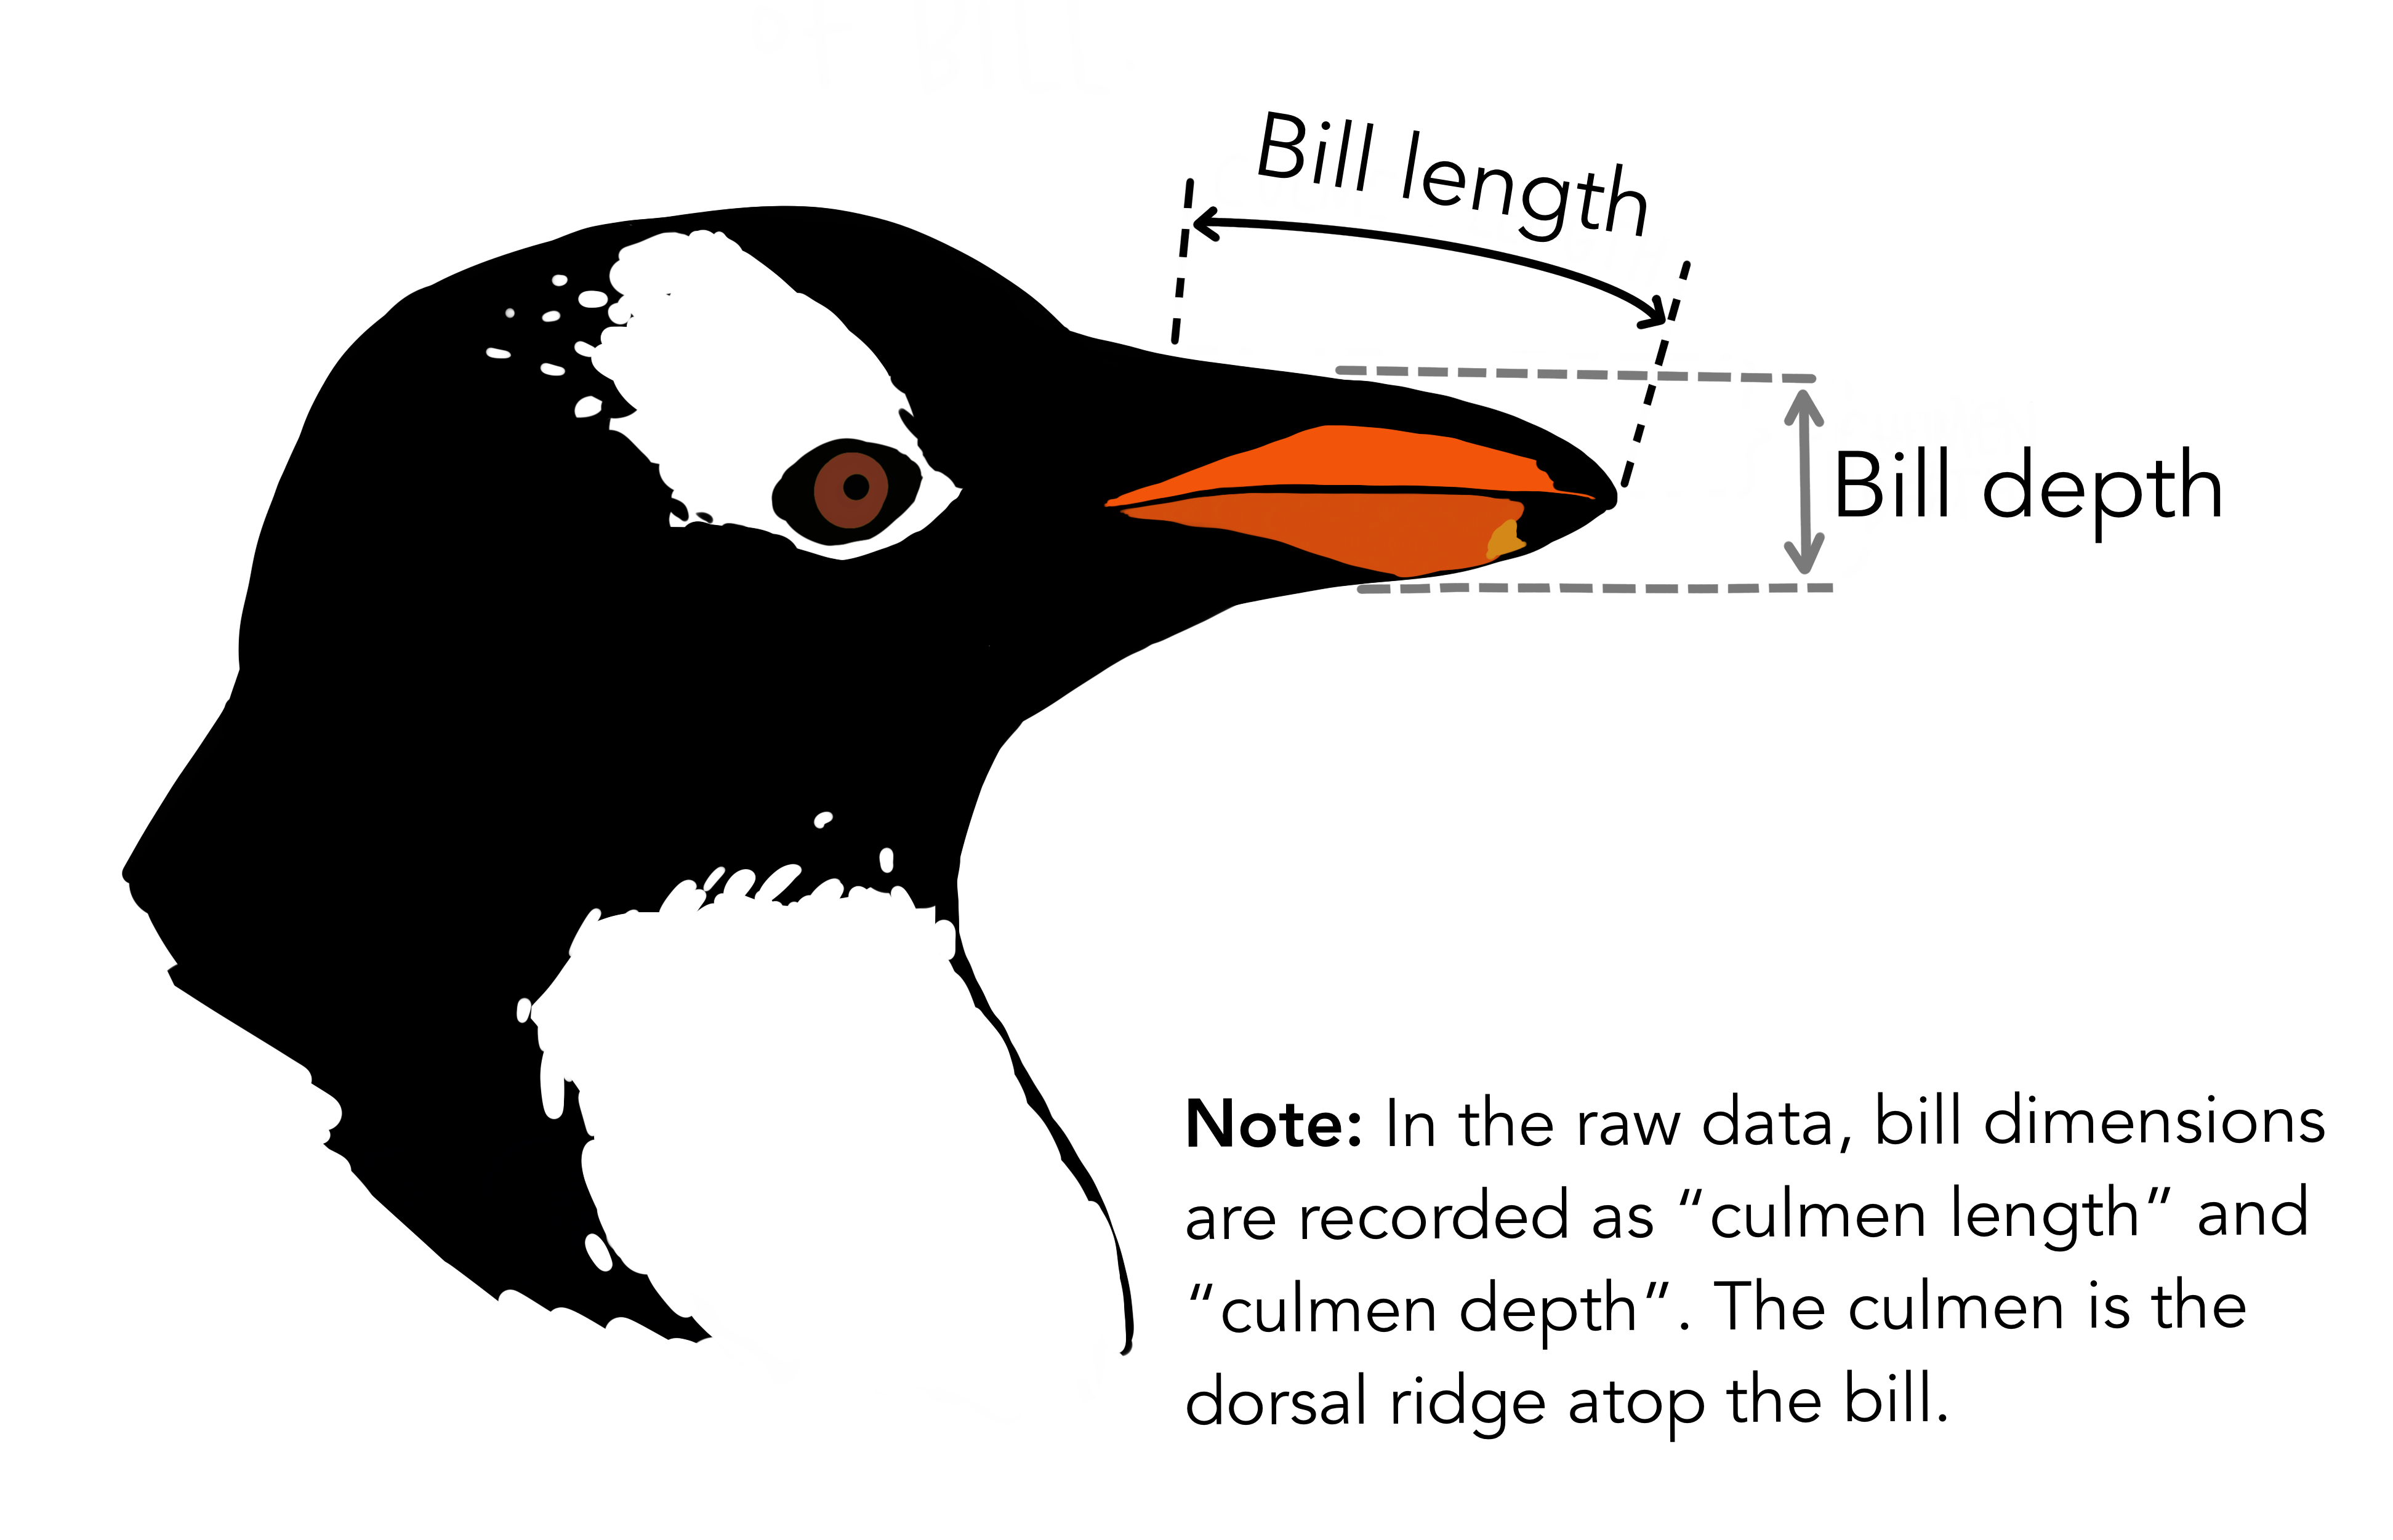
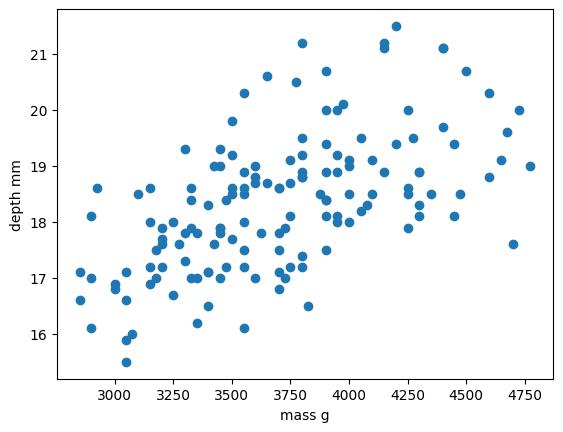
Figure 3
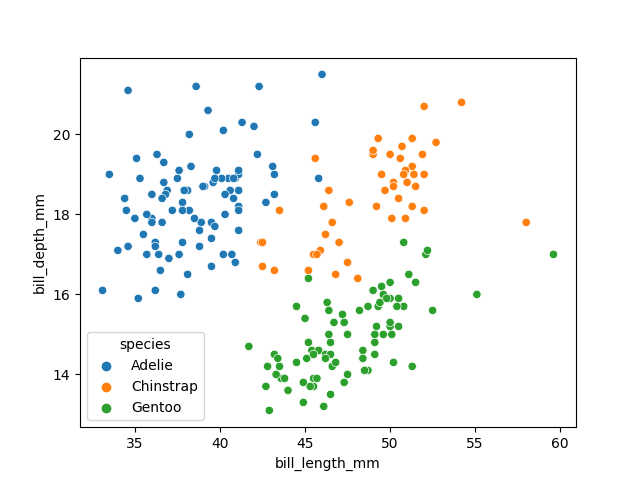
Visualising the penguins dataset
Figure 4
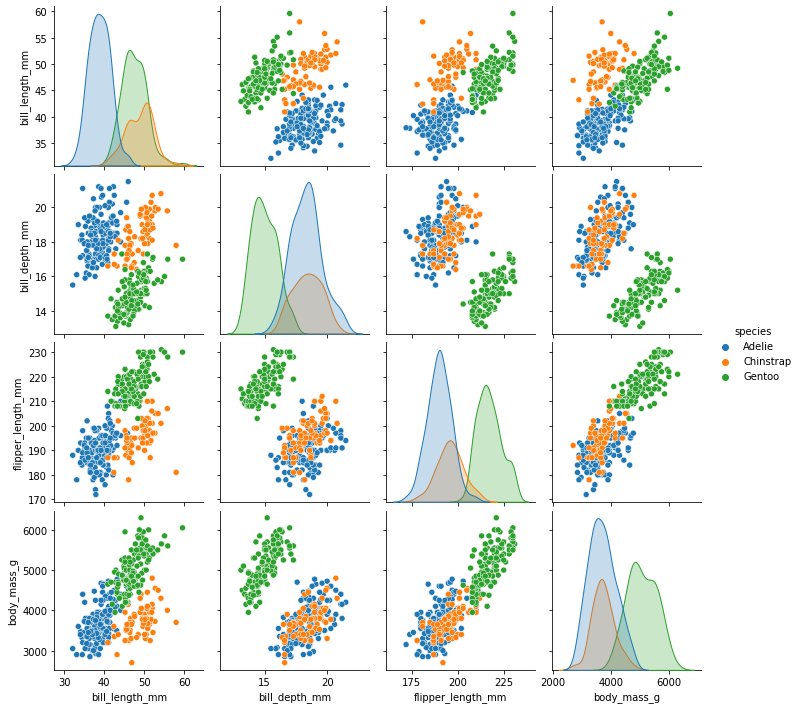
Visualising the penguins dataset
Figure 5
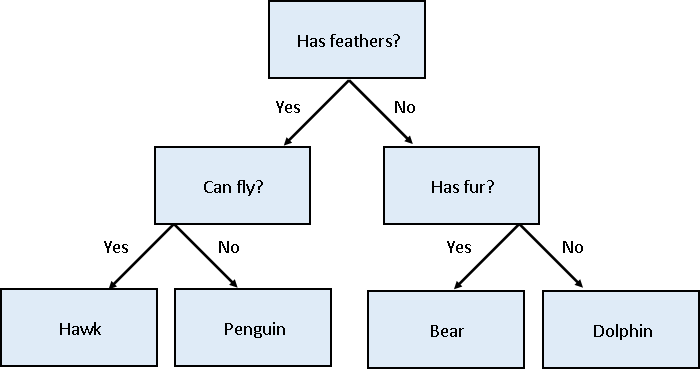
Decision tree for classifying penguins
Figure 6

Decision tree for classifying penguins
Figure 7
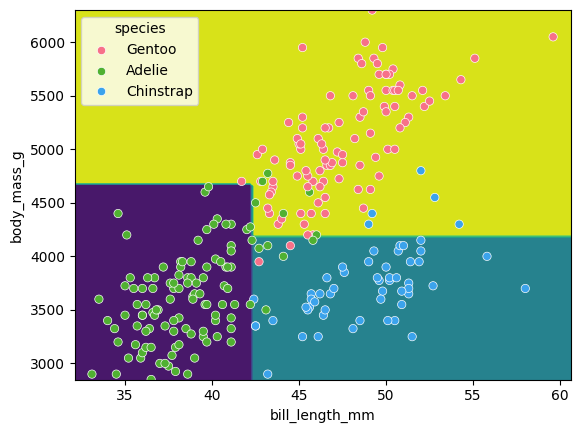
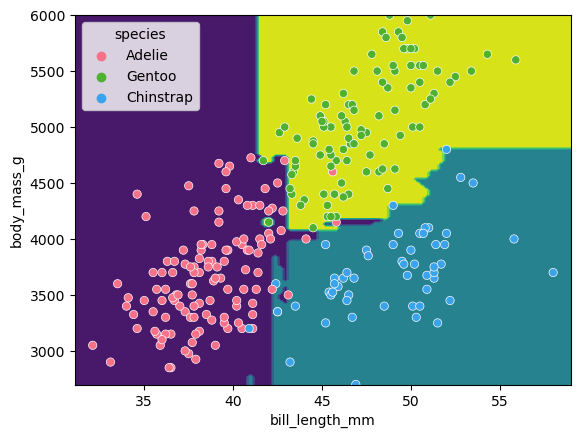
Classification space for our decision tree
Figure 8
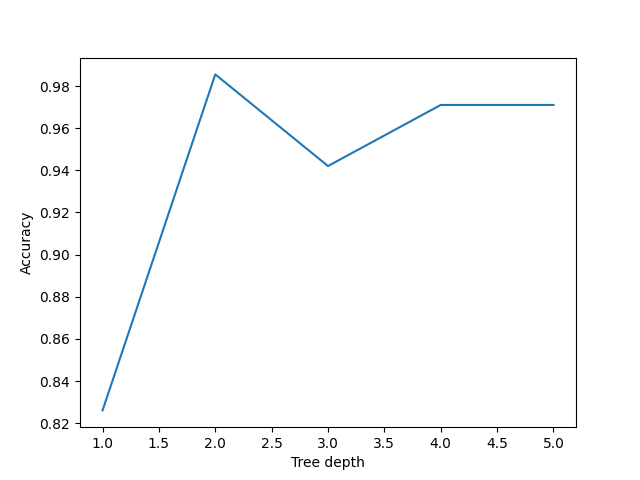
Performance of decision trees of various
depths
Figure 9

Simplified decision tree
Figure 10

Classification space of the simplified decision
tree
Figure 11
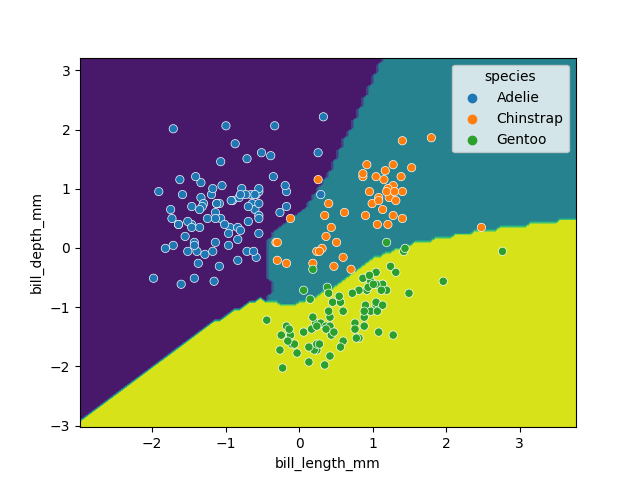
Classification space generated by the SVM
model
Ensemble methodsEnsemble methods
Figure 1
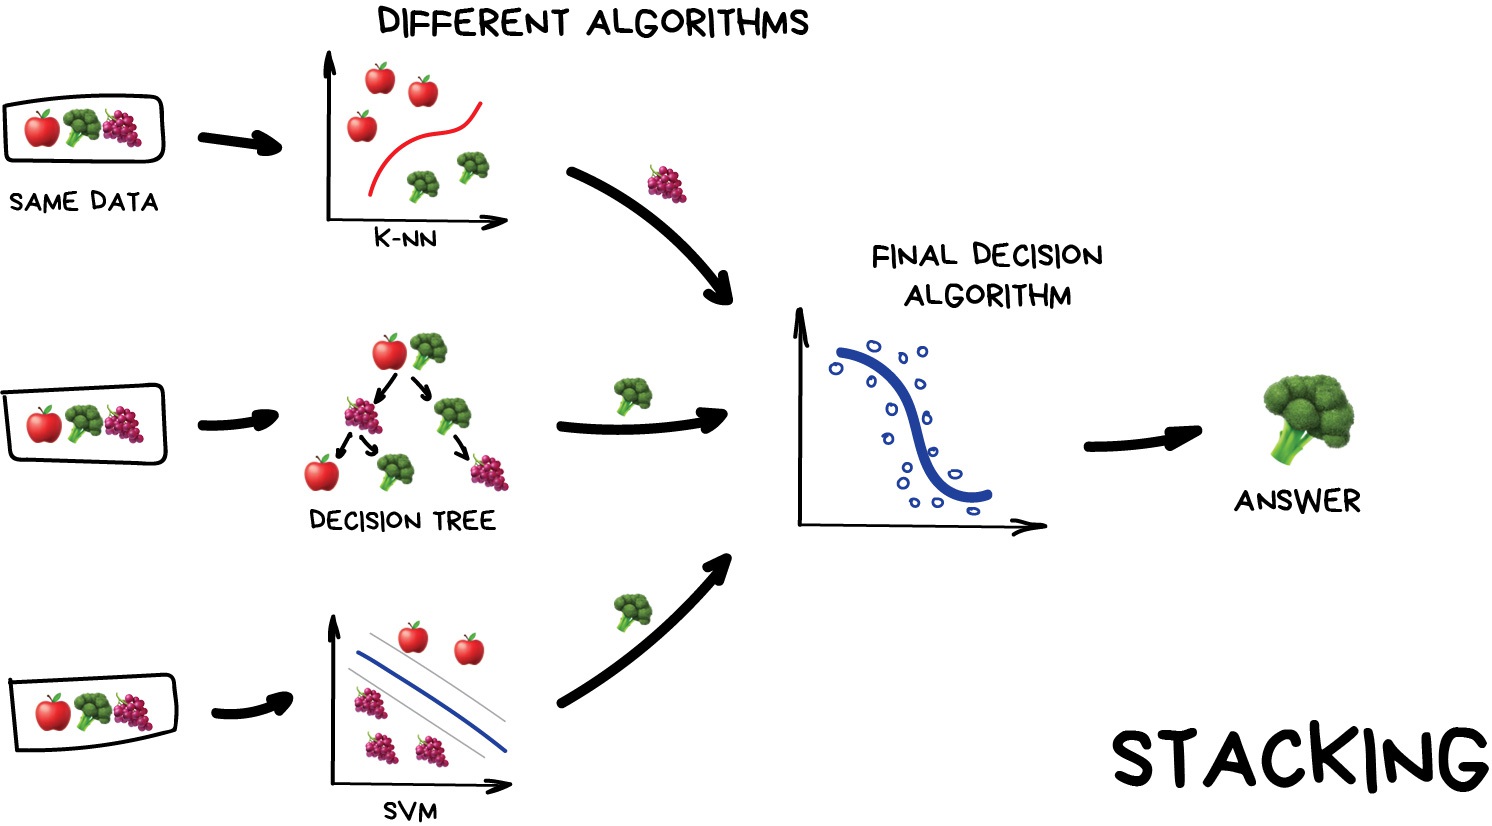
Stacking
Figure 2
Stacking
Figure 3
Stacking
Figure 4
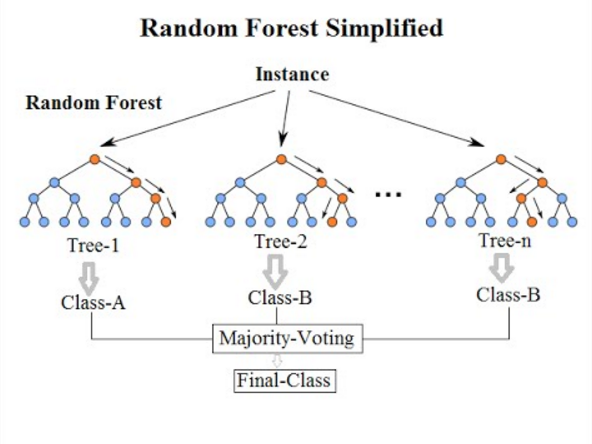
Random Forests
Figure 5
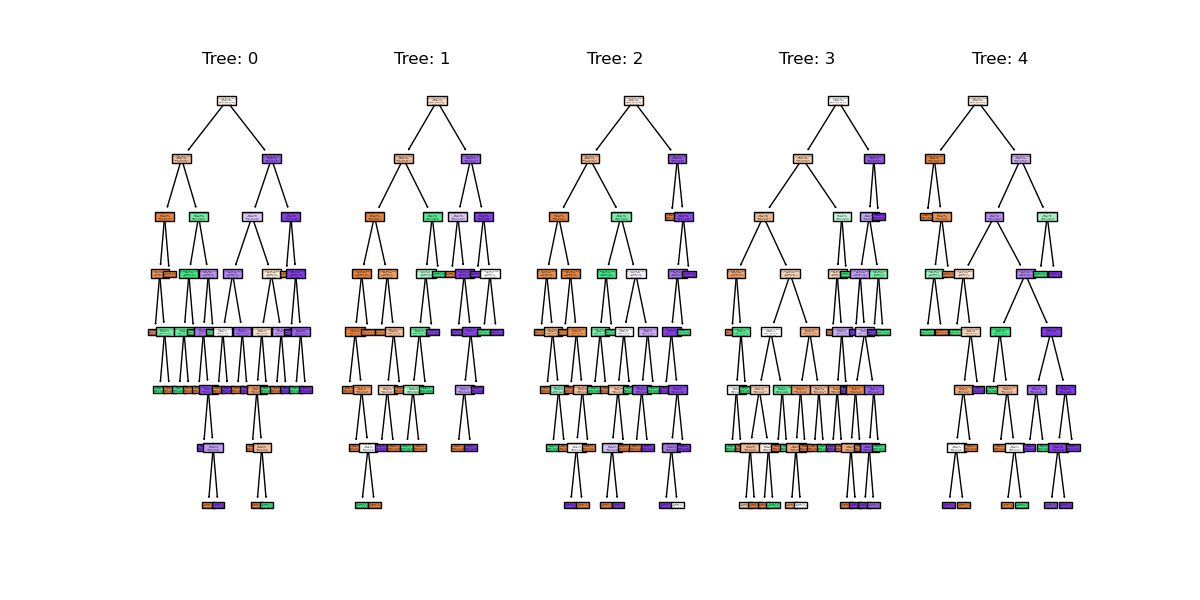
random forest trees
Figure 6
random forest clf space
Figure 7

Regressor predictions and average from
stack
Unsupervised methods - ClusteringUnsupervised learningClustering
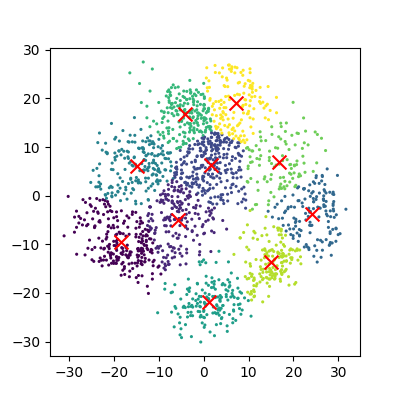
Figure 1
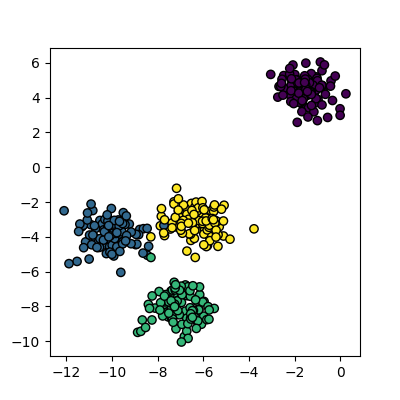
Plot of the random clusters
Figure 2
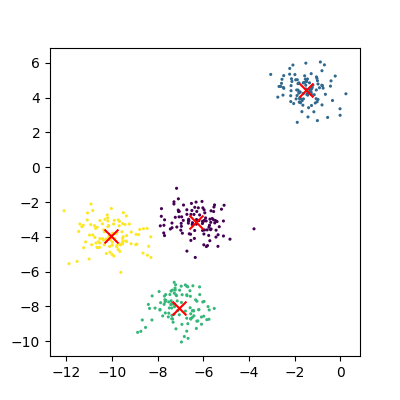
Plot of the fitted random clusters
Figure 3
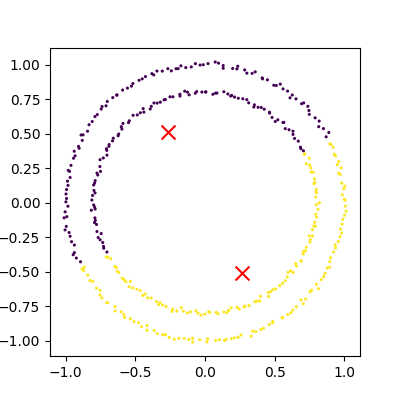
An example of kmeans failing on non-linear
cluster boundaries
Figure 4
Increasing n_samples to 4000 and cluster_std to 3.0 looks like this:
 The straight
line boundaries between clusters look a bit strange.
The straight
line boundaries between clusters look a bit strange.
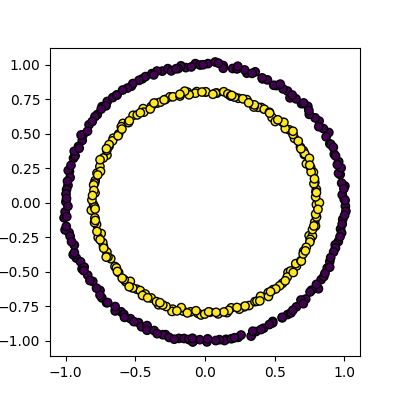
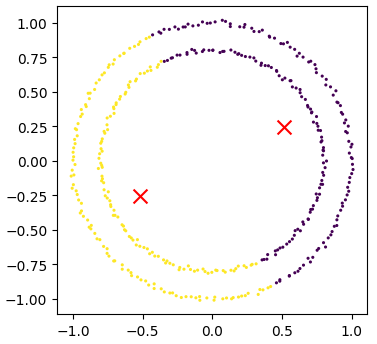
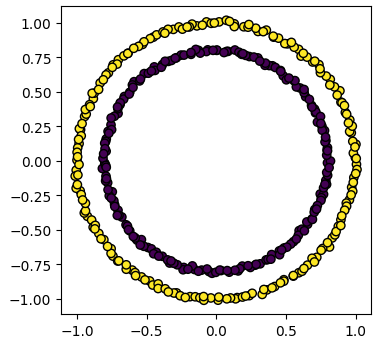
Figure 5
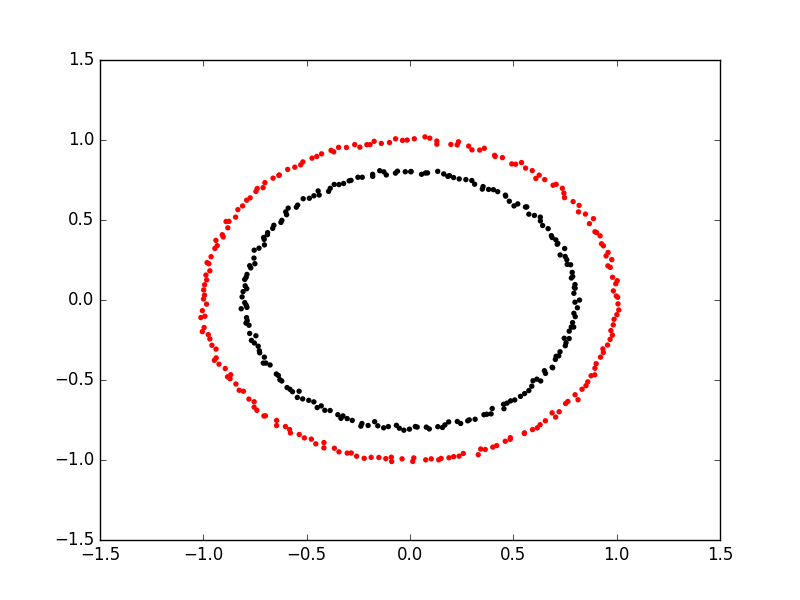
Spectral clustering on two concentric
circles
Figure 6
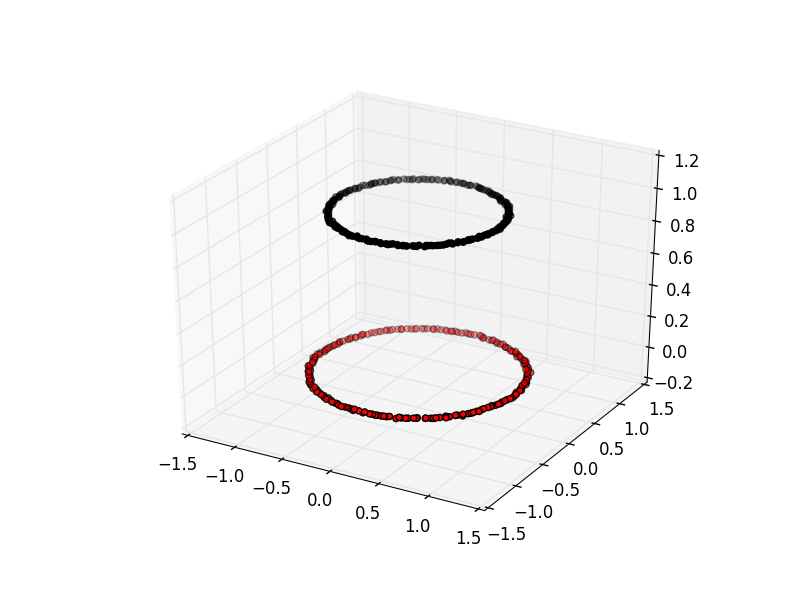
Spectral clustering viewed with an extra
dimension
Figure 7
Unsupervised methods - Dimensionality reductionDimensionality reductionDimensionality reduction with Scikit-Learn
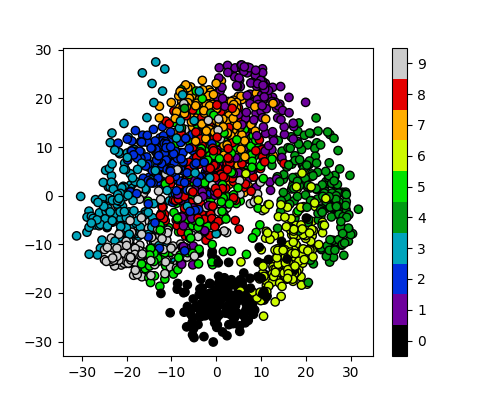
Figure 1
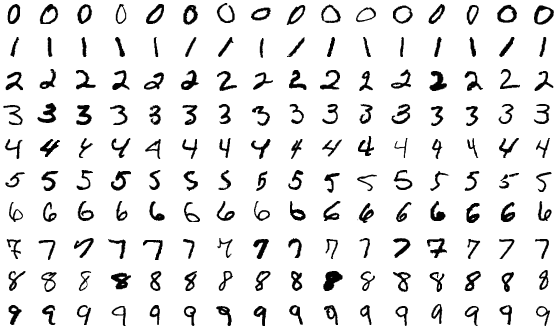
MNIST example illustrating all the classes in
the dataset
Figure 2
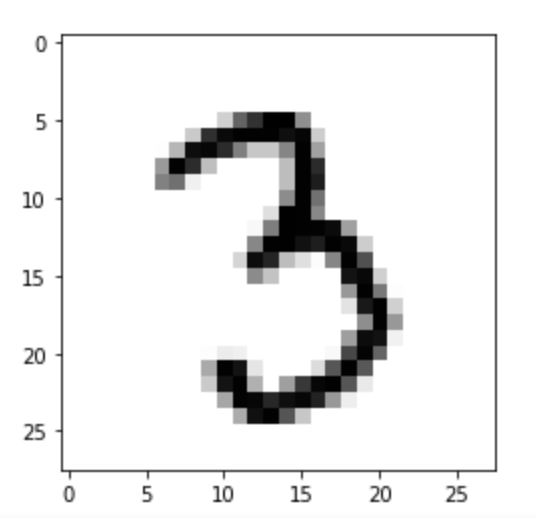
MNIST example of a single image
Figure 3
SKLearn image with highlighted pixels
Figure 4
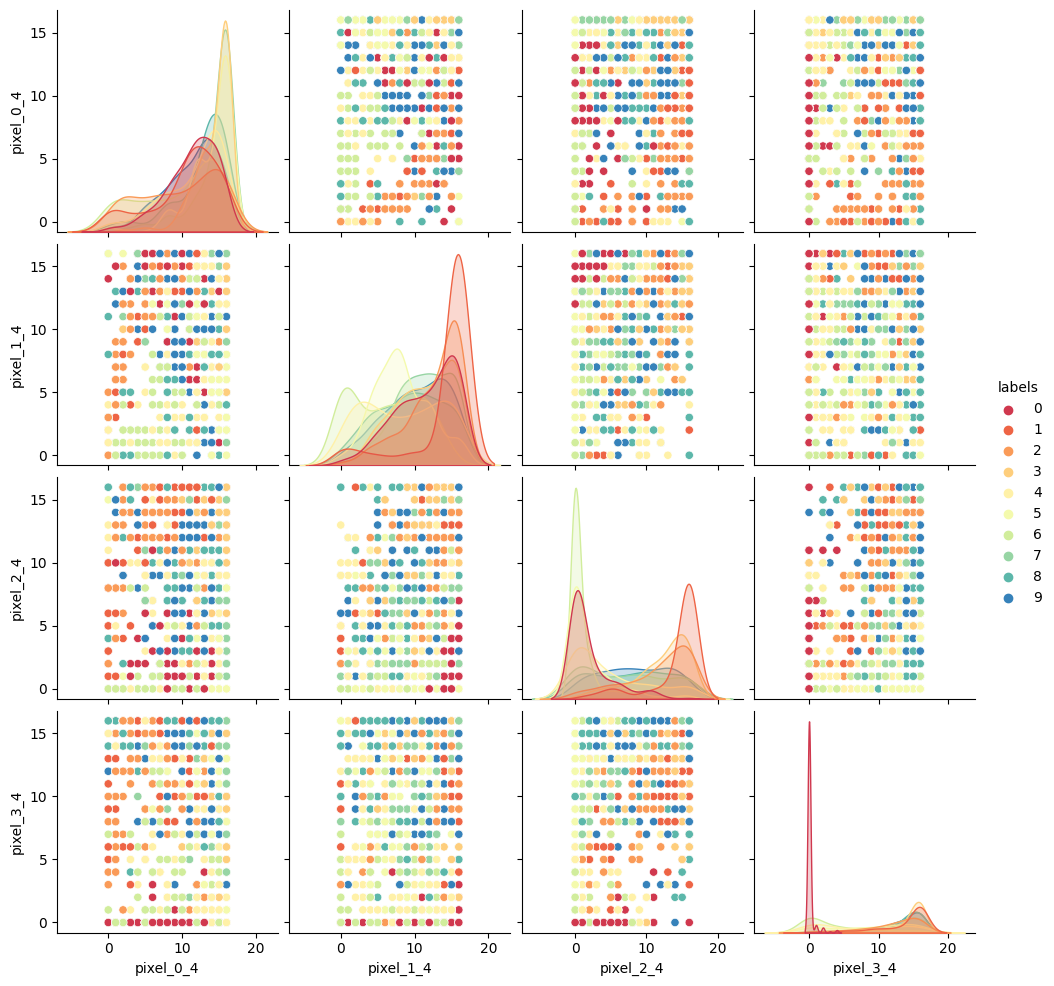
SKLearn image with highlighted pixels
Figure 5
Reduction using PCA
Figure 6
Reduction using PCA
Figure 7
Reduction using PCA
Figure 8
Reduction using PCA
Figure 9
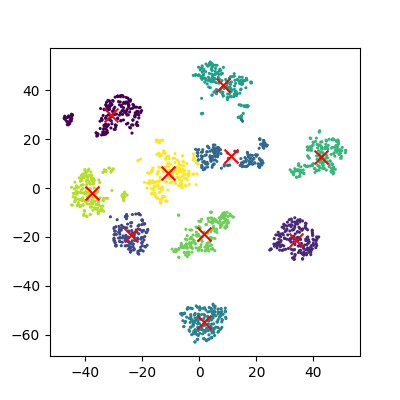
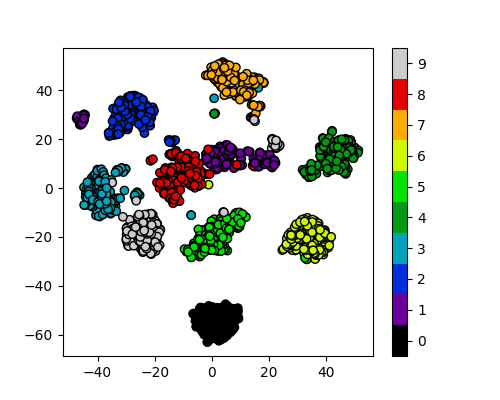
Figure 10

Reduction to 3 components using pca
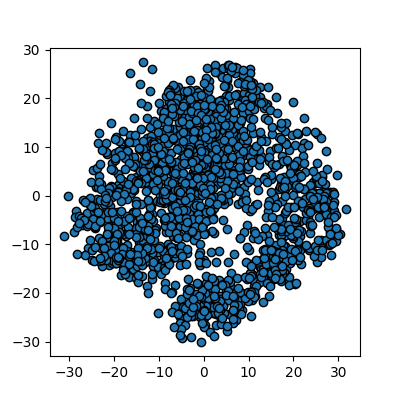
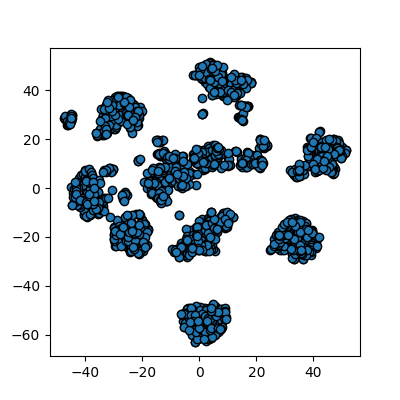
Figure 11

Reduction to 3 components using tsne
Neural NetworksNeural networks
Figure 1

A diagram of a perceptron
Figure 2

A multi-layer perceptron