Coordinate Reference Systems
Overview
Teaching: 15 min
Exercises: 10 minQuestions
What is a coordinate reference system and how do I interpret one?
Objectives
Name some common schemes for describing coordinate reference systems.
Interpret a PROJ4 coordinate reference system description.
Coordinate Reference Systems
A data structure cannot be considered geospatial unless it is accompanied by coordinate reference system (CRS) information, in a format that geospatial applications can use to display and manipulate the data correctly. CRS information connects data to the Earth’s surface using a mathematical model.
CRS vs SRS
CRS (coordinate reference system) and SRS (spatial reference system) are synonyms and are commonly interchanged. We will use only CRS throughout this workshop.
The CRS associated with a dataset tells your mapping software (for example R) where the raster is located in geographic space. It also tells the mapping software what method should be used to flatten or project the raster in geographic space.
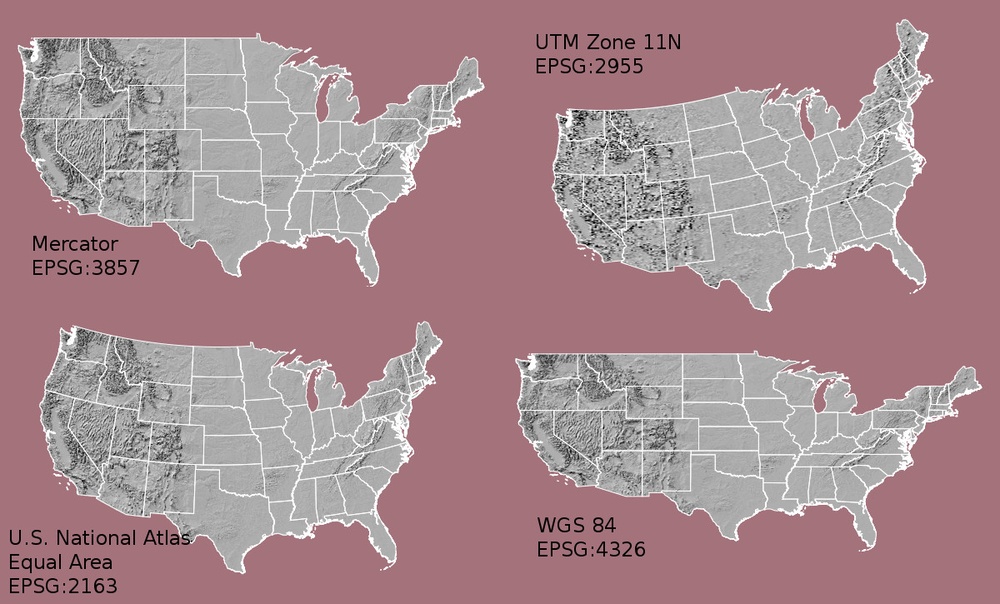
The above image shows maps of the United States in different projections. Notice the differences in shape associated with each projection. These differences are a direct result of the calculations used to flatten the data onto a 2-dimensional map. (Source: opennews.org)
There are lots of great resources that describe coordinate reference systems and projections in greater detail. For the purposes of this workshop, what is important to understand is that data from the same location but saved in different projections will not line up in any GIS or other program. Thus, it’s important when working with spatial data to identify the coordinate reference system applied to the data and retain it throughout data processing and analysis.
Components of a CRS
CRS information has three components:
-
Datum: A model of the shape of the earth. It has angular units (i.e. degrees) and defines the starting point (i.e. where is (0,0)?) so the angles reference a meaningful spot on the earth. Common global datums are WGS84 and NAD83. Datums can also be local - fit to a particular area of the globe, but ill-fitting outside the area of intended use. In this workshop, we will use the WGS84 datum.
-
Projection: A mathematical transformation of the angular measurements on a round earth to a flat surface (i.e. paper or a computer screen). The units associated with a given projection are usually linear (feet, meters, etc.). In this workshop, we will see data in two different projections.
-
Additional Parameters: Additional parameters are often necessary to create the full coordinate reference system. One common additional parameter is a definition of the center of the map. The number of required additional parameters depends on what is needed by each specific projection.
Orange Peel Analogy
A common analogy employed to teach projections is the orange peel analogy. If you imagine that the earth is an orange, how you peel it and then flatten the peel is similar to how projections get made.
- A datum is the choice of fruit to use. Is the earth an orange, a lemon, a lime, a grapefruit?
A projection is how you peel your orange and then flatten the peel.
- An additional parameter could include a definition of the location of the stem of the fruit. What other parameters could be included in this analogy?


Which projection should I use?
To decide if a projection is right for your data, answer these questions:
- What is the area of minimal distortion?
- What aspect of the data does it preserve?
University of Colorado’s Map Projections and the Department of Geo-Information Processing has a good discussion of these aspects of projections. Online tools like Projection Wizard can also help you discover projections that might be a good fit for your data.
Data Tip
Take the time to figure identify a projection that is suited for your project. You don’t have to stick to the ones that are popular.
Describing Coordinate Reference Systems
There are several common systems in use for storing and transmitting CRS information, as well as translating among different CRSs. These systems generally comply with ISO 19111. Common systems for describing CRSs include EPSG, PROJ, and OGC WKT. Most of the data we will be working with in this workshop use the PROJ system.
PROJ is an open-source library for storing, representing and transforming CRS information. PROJ.5 has been recently released, but PROJ.4 was in use for 25 years so you will still mostly see PROJ referred to as PROJ.4. PROJ represents CRS information as a text string of key-value pairs, which makes it easy to customise (and with a little practice, easy to read and interpret).
A PROJ4 string includes the following information:
- proj=: the projection of the data
- zone=: the zone of the data (this is specific to the UTM projection)
- datum=: the datum used
- units=: the units for the coordinates of the data
- ellps=: the ellipsoid (how the earth’s roundness is calculated) for the data
Note that the zone is unique to the UTM projection. Not all CRSs will have a zone.

Image source: Chrismurf at English Wikipedia, via Wikimedia Commons (CC-BY).
Reading a PROJ4 String
Here is a PROJ4 string for one of the datasets we will use in this workshop:
+proj=utm +zone=18 +datum=WGS84 +units=m +no_defs +ellps=WGS84 +towgs84=0,0,0
- What projection, zone, datum, and ellipsoid are used for this data?
- What are the units of the data?
- Using the map above, what part of the United States was this data collected from?
Solution
- Projection is UTM, zone 18, datum is WGS84, ellipsoid is WGS84.
- The data is in meters.
- The data comes from the eastern US seaboard.
Other Common Systems
The EPSG system is a database of CRS information maintained by the International Association of Oil and Gas Producers. The dataset contains both CRS definitions and information on how to safely convert data from one CRS to another. Using EPSG is easy as every CRS has a integer identifier, e.g. WGS84 is EPSG:4326. The downside is that you can only use the CRSs EPSG defines and cannot customise them. Detailed information on the structure of the EPSG dataset is available on their website.
The OGC WKT standard is used by a number of important geospatial apps and software libraries. WKT is a nested list of geodetic parameters. The structure of the information is defined on their website. WKT is valuable in that the CRS information is more transparent than in EPSG, but can be more difficult to read and compare than PROJ. Additionally, the WKT standard is implemented inconsistently across various software platforms, and the spec itself has some known issues).
Format interoperability
Many existing file formats were invented by GIS software developers, often in a closed-source environment. This led to the large number of formats on offer today, and considerable problems transferring data between software environments. The Geospatial Data Abstraction Library (GDAL) is an open-source answer to this issue.
GDAL is a set of software tools that translate between almost any geospatial format in common use today (and some not so common ones). GDAL also contains tools for editing and manipulating both raster and vector files, including reprojecting data to different CRSs. GDAL can be used as a standalone command-line tool, or built in to other GIS software. Several open-source GIS programs use GDAL for all file import/export operations. We will be working with GDAL later in this workshop.
Metadata
Spatial data is useless without metadata. Essential metadata includes the CRS information, but proper spatial metadata encompasses more than that. History and provenance of a dataset (how it was made), who is in charge of maintaining it, and appropriate (and inappropriate!) use cases should also be documented in metadata. This information should accompany a spatial dataset wherever it goes. In practice this can be difficult, as many spatial data formats don’t have a built-in place to hold this kind of information. Metadata often has to be stored in a companion file, and generated and maintained manually.
More Resources on CRS
- spatialreference.org - A comprehensive online library of CRS information.
- QGIS Documentation - CRS Overview.
- Choosing the Right Map Projection.
- NCEAS Overview of CRS in R.
- Video highlighting how map projections can make continents seems proportionally larger or smaller than they actually are.
Key Points
All geospatial datasets (raster and vector) are associated with a specific coordinate reference system.
A coordinate reference system includes datum, projection, and additional parameters specific to the dataset.