Work With Multi-Band Rasters in R
Overview
Teaching: 40 min
Exercises: 20 minQuestions
How can I visualize individual and multiple bands in a raster object?
Objectives
Identify a single vs. a multi-band raster file.
Import multi-band rasters into R using the
rasterpackage.Plot multi-band color image rasters in R using the
ggplotpackage.
Previously we have learned what raster data is, how to look at important metadata information, import and plot it in R. We also looked at raster coordinate reference system.
Those examples were with single band raster data where there was only 1 “layer” of information. Raster data can also be considered multi-band where there are multiple layers. These layers share the same extent, resolution, and crs. Now we will explore how to import and plot a multi-band raster in R.
We will use the same libraries as we have used in the previous episodes.Make sure that you have these packages loaded.
##The Data
In this lesson, we will be working with with both single and multi-band raster. The single-band raster we will use is called HARV_RGB_Ortho.tif.
Things You’ll Need To Complete This Episode
See the lesson homepage for detailed information about the software, data, and other prerequisites you will need to work through the examples in this episode.
We introduced multi-band raster data in an earlier lesson. This episode explores how to import and plot a multi-band raster in R.
Getting Started with Multi-Band Data in R
In this episode, the multi-band data that we are working with is imagery collected using the NEON Airborne Observation Platform high resolution camera over the NEON Harvard Forest field site. Each RGB image is a 3-band raster. The same steps would apply to working with a multi-spectral image with 4 or more bands - like Landsat imagery.
We can use the same raster() function for a mult-band raster as we have been using for single-band raster data. When we read a multi-band raster file into R using the raster() function, it only reads
in the first band. I am using “band1” in the object name to signify that only the first band of this raster is being loaded.
RGB_band1_HARV <- raster("data/raster/HARV_RGB_Ortho.tif")
We need to convert this data to a data frame in order to plot it with ggplot.
RGB_band1_HARV_df <- as.data.frame(RGB_band1_HARV, xy = TRUE)
ggplot() +
  geom_raster(data = RGB_band1_HARV_df,
              aes(x = x, y = y, alpha = HARV_RGB_Ortho)) +
  coord_quickmap()

Challenge
View the attributes of this band. What are its dimensions, CRS, resolution, min and max values, and band number?
Solution
RGB_band1_HARVclass : RasterLayer band : 1 (of 3 bands) dimensions : 1571, 1938, 3044598 (nrow, ncol, ncell) resolution : 0.25, 0.25 (x, y) extent : 731998.5, 732483, 4712956, 4713349 (xmin, xmax, ymin, ymax) crs : +proj=utm +zone=18 +datum=WGS84 +units=m +no_defs +ellps=WGS84 +towgs84=0,0,0 source : /home/travis/build/UW-Madison-DataScience/r-raster-vector-geospatial/_episodes_rmd/data/raster/HARV_RGB_Ortho.tif names : HARV_RGB_Ortho values : 0, 255 (min, max)Notice that when we look at the attributes of this band, we see:
band: 1 (of 3 bands)This is R telling us that this particular raster object has more bands (3) associated with it.
Data Tip
The number of bands associated with a raster object can also be determined using the
nbands()function: syntax isnbands(RGB_band1_HARV).
Image Raster Data Values
As we saw in the previous exercise, this raster contains values between 0 and 255. These values represent degrees of brightness associated with the image band. In the case of a RGB image (red, green and blue), band 1 is the red band. When we plot the red band, larger numbers (towards 255) represent pixels with more red in them (a strong red reflection). Smaller numbers (towards 0) represent pixels with less red in them (less red was reflected). To plot an RGB image, we mix red + green + blue values into one single color to create a full color image - similar to the color image a digital camera creates.
Import A Specific Band
We can use the raster() function to import specific bands in our raster object
by specifying which band we want with band = N (N represents the band number we
want to work with). To import the green band, we would use band = 2.
RGB_band2_HARV <- raster("data/raster/HARV_RGB_Ortho.tif", band = 2)
We can convert this data to a data frame and plot the same way we plotted the red band:
RGB_band2_HARV_df <- as.data.frame(RGB_band2_HARV, xy = TRUE)
ggplot() +
  geom_raster(data = RGB_band2_HARV_df,
              aes(x = x, y = y, alpha = HARV_RGB_Ortho)) +
  coord_equal()

Raster Stacks in R
Next, we will work with all three image bands (red, green and blue) as an R RasterStack object. We will then plot a 3-band composite, or full color, image.
To bring in all bands of a multi-band raster, we use thestack() function.
RGB_stack_HARV <- stack("data/raster/HARV_RGB_Ortho.tif")
Let’s preview the attributes of our stack object:
RGB_stack_HARV
class      : RasterStack
dimensions : 1571, 1938, 3044598, 3  (nrow, ncol, ncell, nlayers)
resolution : 0.25, 0.25  (x, y)
extent     : 731998.5, 732483, 4712956, 4713349  (xmin, xmax, ymin, ymax)
crs        : +proj=utm +zone=18 +datum=WGS84 +units=m +no_defs +ellps=WGS84 +towgs84=0,0,0
names      : HARV_RGB_Ortho.1, HARV_RGB_Ortho.2, HARV_RGB_Ortho.3
min values :                0,                0,                0
max values :              255,              255,              255
We can view the attributes of each band in the stack in a single output:
RGB_stack_HARV@layers
[[1]]
class      : RasterLayer
band       : 1  (of  3  bands)
dimensions : 1571, 1938, 3044598  (nrow, ncol, ncell)
resolution : 0.25, 0.25  (x, y)
extent     : 731998.5, 732483, 4712956, 4713349  (xmin, xmax, ymin, ymax)
crs        : +proj=utm +zone=18 +datum=WGS84 +units=m +no_defs +ellps=WGS84 +towgs84=0,0,0
source     : /home/travis/build/UW-Madison-DataScience/r-raster-vector-geospatial/_episodes_rmd/data/raster/HARV_RGB_Ortho.tif
names      : HARV_RGB_Ortho.1
values     : 0, 255  (min, max)


[[2]]
class      : RasterLayer
band       : 2  (of  3  bands)
dimensions : 1571, 1938, 3044598  (nrow, ncol, ncell)
resolution : 0.25, 0.25  (x, y)
extent     : 731998.5, 732483, 4712956, 4713349  (xmin, xmax, ymin, ymax)
crs        : +proj=utm +zone=18 +datum=WGS84 +units=m +no_defs +ellps=WGS84 +towgs84=0,0,0
source     : /home/travis/build/UW-Madison-DataScience/r-raster-vector-geospatial/_episodes_rmd/data/raster/HARV_RGB_Ortho.tif
names      : HARV_RGB_Ortho.2
values     : 0, 255  (min, max)


[[3]]
class      : RasterLayer
band       : 3  (of  3  bands)
dimensions : 1571, 1938, 3044598  (nrow, ncol, ncell)
resolution : 0.25, 0.25  (x, y)
extent     : 731998.5, 732483, 4712956, 4713349  (xmin, xmax, ymin, ymax)
crs        : +proj=utm +zone=18 +datum=WGS84 +units=m +no_defs +ellps=WGS84 +towgs84=0,0,0
source     : /home/travis/build/UW-Madison-DataScience/r-raster-vector-geospatial/_episodes_rmd/data/raster/HARV_RGB_Ortho.tif
names      : HARV_RGB_Ortho.3
values     : 0, 255  (min, max)
If we have hundreds of bands, we can specify which band we’d like to view attributes for using an index value:
RGB_stack_HARV[[2]]
class      : RasterLayer
band       : 2  (of  3  bands)
dimensions : 1571, 1938, 3044598  (nrow, ncol, ncell)
resolution : 0.25, 0.25  (x, y)
extent     : 731998.5, 732483, 4712956, 4713349  (xmin, xmax, ymin, ymax)
crs        : +proj=utm +zone=18 +datum=WGS84 +units=m +no_defs +ellps=WGS84 +towgs84=0,0,0
source     : /home/travis/build/UW-Madison-DataScience/r-raster-vector-geospatial/_episodes_rmd/data/raster/HARV_RGB_Ortho.tif
names      : HARV_RGB_Ortho.2
values     : 0, 255  (min, max)
We can also use the ggplot functions to plot the data in any layer
of our RasterStack object. Remember, we need to convert to a data
frame first.
RGB_stack_HARV_df <- as.data.frame(RGB_stack_HARV, xy = TRUE)
Each band in our RasterStack gets its own column in the data frame. Thus we have:
str(RGB_stack_HARV_df)
'data.frame':	3044598 obs. of  5 variables:
 $ x               : num  731999 731999 731999 731999 732000 ...
 $ y               : num  4713349 4713349 4713349 4713349 4713349 ...
 $ HARV_RGB_Ortho.1: num  0 0 0 0 0 0 0 0 0 0 ...
 $ HARV_RGB_Ortho.2: num  0 0 0 0 0 0 0 0 0 0 ...
 $ HARV_RGB_Ortho.3: num  0 0 0 0 0 0 0 0 0 0 ...
Let’s create a histogram of the first band:
ggplot() +
  geom_histogram(data = RGB_stack_HARV_df, aes(HARV_RGB_Ortho.1))
`stat_bin()` using `bins = 30`. Pick better value with `binwidth`.

And a raster plot of the second band:
ggplot() +
  geom_raster(data = RGB_stack_HARV_df,
              aes(x = x, y = y, alpha = HARV_RGB_Ortho.2)) +
  coord_quickmap()

We can access any individual band in the same way.
Create A Three Band Image
To render a final three band, colored image in R, we use the plotRGB() function.
This function allows us to:
- Identify what bands we want to render in the red, green and blue regions. The
plotRGB()function defaults to a 1=red, 2=green, and 3=blue band order. However, you can define what bands you’d like to plot manually. Manual definition of bands is useful if you have, for example a near-infrared band and want to create a color infrared image. - Adjust the
stretchof the image to increase or decrease contrast.
Let’s plot our 3-band image. Note that we can use the plotRGB()
function directly with our RasterStack object (we don’t need a
dataframe as this function isn’t part of the ggplot2 package).
plotRGB(RGB_stack_HARV,
        r = 1, g = 2, b = 3)

The image above looks pretty good. We can explore whether applying a stretch to
the image might improve clarity and contrast by specifying stretch="lin" or
stretch="hist".
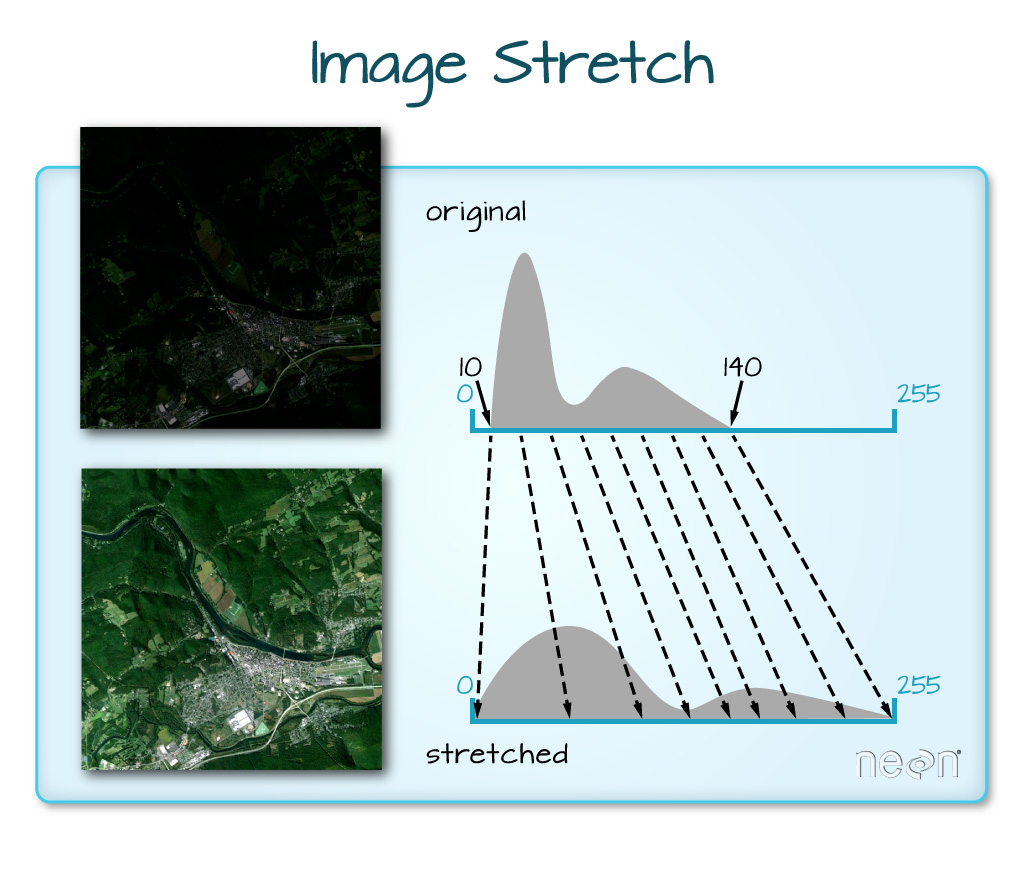
When the range of pixel brightness values is closer to 0, a darker image is rendered by default. We can stretch the values to extend to the full 0-255 range of potential values to increase the visual contrast of the image.
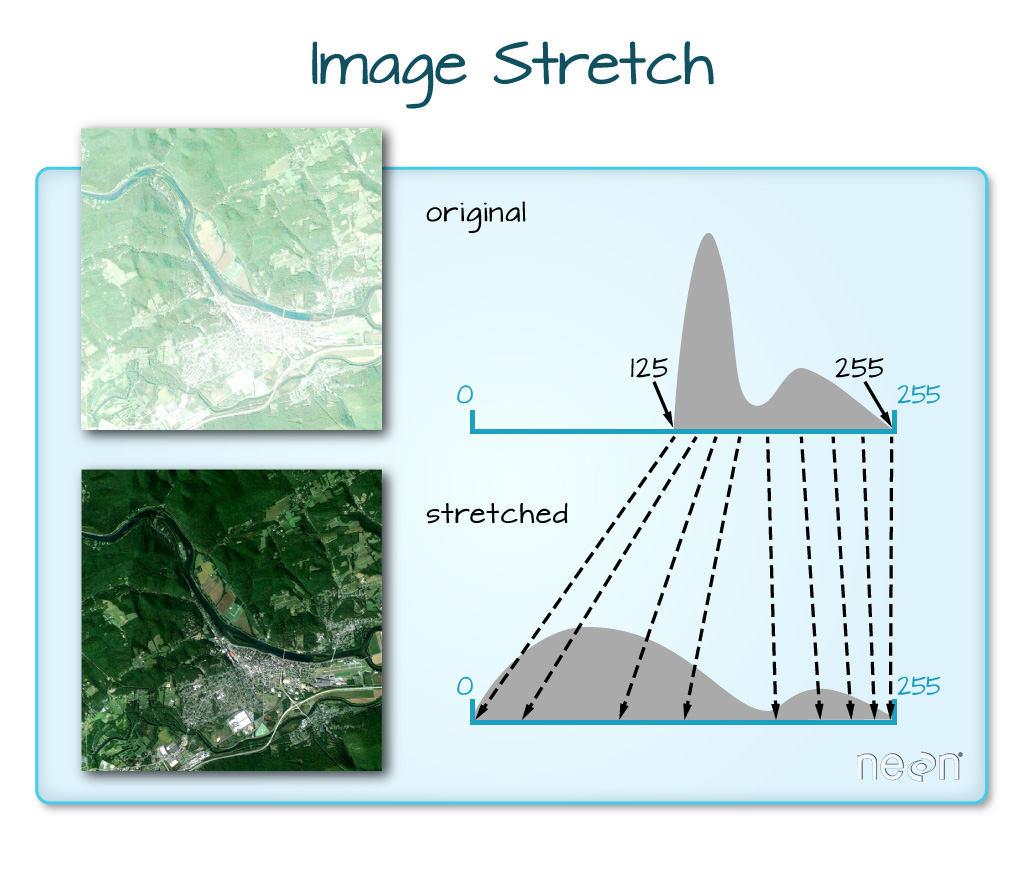
When the range of pixel brightness values is closer to 255, a lighter image is rendered by default. We can stretch the values to extend to the full 0-255 range of potential values to increase the visual contrast of the image.
plotRGB(RGB_stack_HARV,
        r = 1, g = 2, b = 3,
        scale = 800,
        stretch = "lin")

plotRGB(RGB_stack_HARV,
        r = 1, g = 2, b = 3,
        scale = 800,
        stretch = "hist")

In this case, the stretch doesn’t enhance the contrast our image significantly given the distribution of reflectance (or brightness) values is distributed well between 0 and 255.
Challenge - NoData Values
Let’s explore what happens with NoData values when working with RasterStack objects and using the
plotRGB()function. We will use theHARV_Ortho_wNA.tifGeoTIFF file in thedata/raster/directory.
- View the files attributes. Are there
NoDatavalues assigned for this file?- If so, what is the
NoDataValue?- How many bands does it have?
- Load the multi-band raster file into R.
- Plot the object as a true color image.
- What happened to the black edges in the data?
- What does this tell us about the difference in the data structure between
HARV_Ortho_wNA.tifandHARV_RGB_Ortho.tif(R objectRGB_stack). How can you check?Answers
1) First we use the
GDALinfo()function to view the data attributes.GDALinfo("data/raster/HARV_Ortho_wNA.tif")Warning in GDALinfo("data/raster/HARV_Ortho_wNA.tif"): statistics not supported by this driver Warning in GDALinfo("data/raster/HARV_Ortho_wNA.tif"): statistics not supported by this driver Warning in GDALinfo("data/raster/HARV_Ortho_wNA.tif"): statistics not supported by this driverrows 1692 columns 1973 bands 3 lower left origin.x 731989.8 lower left origin.y 4712926 res.x 0.25 res.y 0.25 ysign -1 oblique.x 0 oblique.y 0 driver GTiff projection +proj=utm +zone=18 +datum=WGS84 +units=m +no_defs file data/raster/HARV_Ortho_wNA.tif apparent band summary: GDType hasNoDataValue NoDataValue blockSize1 blockSize2 1 Float32 TRUE -9999 1 1973 2 Float32 TRUE -9999 1 1973 3 Float32 TRUE -9999 1 1973 apparent band statistics: Bmin Bmax Bmean Bsd 1 -4294967295 4294967295 NA NA 2 -4294967295 4294967295 NA NA 3 -4294967295 4294967295 NA NA Metadata: AREA_OR_POINT=Area2) From the output above, we see that there are
NoDatavalues and they are assigned the value of -9999.3) The data has three bands.
4) To read in the file, we will use the
stack()function:HARV_NA <- stack("data/raster/HARV_Ortho_wNA.tif")5) We can plot the data with the
plotRGB()function:plotRGB(HARV_NA, r = 1, g = 2, b = 3)
6) The black edges are not plotted. 7) Both data sets have
NoDatavalues, however, in the RGB_stack the NoData value is not defined in the tiff tags, thus R renders them as black as the reflectance values are 0. The black edges in the other file are defined as -9999 and R renders them as NA.GDALinfo("data/raster/HARV_RGB_Ortho.tif")rows 1571 columns 1938 bands 3 lower left origin.x 731998.5 lower left origin.y 4712956 res.x 0.25 res.y 0.25 ysign -1 oblique.x 0 oblique.y 0 driver GTiff projection +proj=utm +zone=18 +datum=WGS84 +units=m +no_defs file data/raster/HARV_RGB_Ortho.tif apparent band summary: GDType hasNoDataValue NoDataValue blockSize1 blockSize2 1 Float32 TRUE -3.4e+38 1 1938 2 Float32 TRUE -3.4e+38 1 1938 3 Float32 TRUE -3.4e+38 1 1938 apparent band statistics: Bmin Bmax Bmean Bsd 1 0 255 102.4938 39.89983 2 0 255 123.6979 45.93316 3 0 255 90.4154 28.54954 Metadata: AREA_OR_POINT=Area

Data Tip
We can create a RasterStack from several, individual single-band GeoTIFFs too. We will do this in a later episode, Raster Time Series Data in R.
RasterStack vs RasterBrick in R
The R RasterStack and RasterBrick object types can both store multiple bands. However, how they store each band is different. The bands in a RasterStack are stored as links to raster data that is located somewhere on our computer. A RasterBrick contains all of the objects stored within the actual R object. In most cases, we can work with a RasterBrick in the same way we might work with a RasterStack. However a RasterBrick is often more efficient and faster to process - which is important when working with larger files.
More Resources
You can read the help for the
brick()function by typing?brick.
We can turn a RasterStack into a RasterBrick in R by using
brick(StackName). Let’s use the object.size() function to compare RasterStack and RasterBrick objects. First we will check
the size of our RasterStack object:
object.size(RGB_stack_HARV)
44248 bytes
Now we will create a RasterBrick object from our RasterStack data and view its size:
RGB_brick_HARV <- brick(RGB_stack_HARV)

object.size(RGB_brick_HARV)
73084136 bytes
Notice that in the RasterBrick, all of the bands are stored within the actual object. Thus, the RasterBrick object size is much larger than the RasterStack object.
You use the plotRGB() function to plot a RasterBrick too:
plotRGB(RGB_brick_HARV)

Challenge: What Functions Can Be Used on an R Object of a particular class?
We can view various functions (or methods) available to use on an R object with
methods(class=class(objectNameHere)). Use this to figure out:
- What methods can be used on the
RGB_stack_HARVobject?- What methods can be used on a single band within
RGB_stack_HARV?- Why do you think there is a difference?
Answers
1) We can see a list of all of the methods available for our RasterStack object:
methods(class=class(RGB_stack_HARV))[1] ! != [ [4] [[ [[<- [<- [7] %in% == $ [10] $<- addLayer adjacent [13] aggregate all.equal animate [16] approxNA area Arith [19] as.array as.character as.data.frame [22] as.integer as.list as.logical [25] as.matrix as.vector atan2 [28] bbox boxplot brick [31] calc cellFromRowCol cellFromRowColCombine [34] cellFromXY cellStats clamp [37] click coerce colFromCell [40] colFromX colSums Compare [43] coordinates corLocal couldBeLonLat [46] cover crop crosstab [49] crs<- cut cv [52] density dim dim<- [55] disaggregate dropLayer extend [58] extent extract flip [61] freq getValues getValuesBlock [64] getValuesFocal hasValues head [67] hist image init [70] interpolate intersect is.factor [73] is.finite is.infinite is.na [76] is.nan isLonLat KML [79] labels length levels [82] levels<- log Logic [85] mask match Math [88] Math2 maxValue mean [91] merge minValue modal [94] mosaic names names<- [97] ncell ncol ncol<- [100] nlayers nrow nrow<- [103] origin origin<- overlay [106] pairs persp plot [109] plotRGB predict print [112] proj4string proj4string<- quantile [115] raster rasterize ratify [118] readAll readStart readStop [121] reclassify rectify res [124] res<- resample rotate [127] rowColFromCell rowFromCell rowFromY [130] rowSums sampleRandom sampleRegular [133] scale select setMinMax [136] setValues shift show [139] spplot stack stackSelect [142] stretch subs subset [145] Summary summary t [148] tail text trim [151] unique unstack values [154] values<- weighted.mean which.max [157] which.min whiches.max whiches.min [160] wkt writeRaster xFromCell [163] xFromCol xmax xmax<- [166] xmin xmin<- xres [169] xyFromCell yFromCell yFromRow [172] ymax ymax<- ymin [175] ymin<- yres zonal [178] zoom see '?methods' for accessing help and source code2) And compare that with the methods available for a single band:
methods(class=class(RGB_stack_HARV[1]))Warning in .S3methods(generic.function, class, envir): 'class' is of length > 1; only the first element will be used[1] [ [<- anyDuplicated as_tibble as.data.frame [6] as.raster bind boxplot brick coerce [11] coordinates determinant duplicated edit extent [16] extract head initialize isSymmetric Math [21] Math2 Ops raster rasterize relist [26] subset summary surfaceArea tail trim [31] unique weighted.mean writeValues see '?methods' for accessing help and source code3) There are far more things one could or want to ask of a full stack than of a single band.
Key Points
A single raster file can contain multiple bands or layers.
Use the
stack()function to load all bands in a multi-layer raster file into R.Individual bands within a stack can be accessed, analyzed, and visualized using the same functions as single bands.